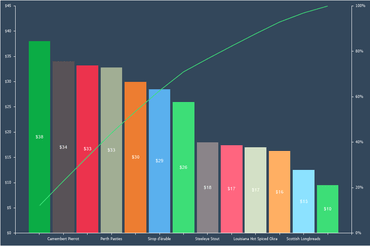
Pareto Chart - When designing dashboards, you now have the ability to create Pareto charts. This type of chart contains both bars and a line graph, where individual values are represented in descending order by bars, and the cumulative total is represented by the line.
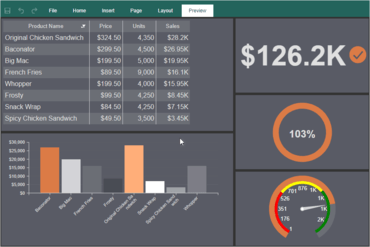
Top N Values - Chart, Indicator, Progress and Pivot dashboard elements can now display top values.
Disabling columns in Table - You can now hide columns in dashboard Table elements. In order to apply this, select the data field in the element editor and uncheck the Visible option.
Hyperlinks in values of a table - You can now set hyperlinks, if the field type is defined as a Dimension, for data field values.
Interaction - You can now customize interactive actions when viewing the dashboard. Depending on a specific user action, a hint can be displayed, data filtering can be applied, or transition by a hyperlink. Actions can be defined for items such as Chart, Regional Map, and Table.
Abbreviations in formatting - You can now use abbreviated numbers with numeric and currency formatting in reports or dashboards. For example, for thousands of values you may use the abbreviation K, for millionths M, for billionths B. To enable the use of abbreviations of values, set the checkbox next to Use Abbreviation in the format editor.
Negative red - Highlight all negative numbers with numeric, currency, and percentage formatting. This functionality will work for both reports and dashboards. To do this, set the checkbox next to Negative in Red in the format editor. Now all numbers that are less than zero will be marked in red.
Export to JSON - To convert the report, click Save in the report viewer, select the item Data File... and select JavaScript Object Notation (JSON) as the file type. You can export a whole report or data only or data with header and footers.
Exporting tables to Data - In the dashboard Table element, you now can export data of various types to files. To do this, when viewing the dashboard, click the Save button on the Table element and select the Data item. In the export settings menu, choose the type of data file (CSV, DBF, XML, JSON, DIF, SYLK) to which the contents of the Table element should be converted.
Export settings - This version adds export settings when exporting dashboards or their elements to various formats. You can change the page size, orientation, image quality, image type and scale. Export settings are displayed in a pop-up dialog, after selecting the export command and before starting the process of converting dashboards or their elements.
Editing the rendered dashboard - The Edit button has been added to the dashboard preview. This button calls the report designer and opens the rendered dashboard. In the report designer, you can edit the dashboard and save the changes. You will these changes in the viewer.
Calculation of totals by condition - It is now possible to use the functions of calculated totals with conditions in dashboard elements. The SumIf(,) function is used to sum the data field values by a condition, and the CountIf(,) function is used to count the number of values in a data field by a condition. The first argument in these functions is the data field, and the second is the condition for fetching values.
Chart, Indicator, Progress and Pivot dashboard elements can now display top values.
Features
Pareto Chart - When designing reports and dashboards, you now have the ability to create Pareto charts. This type of chart contains both bars and a line graph, where individual values are represented in descending order by bars, and the cumulative total is represented by the line.
Top N Values - Chart, Indicator, Progress and Pivot dashboard elements can now display top values.
Disabling columns in Table - You can now hide columns in dashboard Table elements. In order to apply this, select the data field in the element editor and uncheck the Visible option.
Hyperlinks in values of a table - You can now set hyperlinks, if the field type is defined as a Dimension, for data field values.
Interaction - You can now customize interactive actions when viewing the dashboard. Depending on a specific user action, a hint can be displayed, data filtering can be applied, or transition by a hyperlink. Actions can be defined for items such as Chart, Regional Map, and Table.
Abbreviations in formatting - You can now use abbreviated numbers with numeric and currency formatting in reports or dashboards. For example, for thousands of values you may use the abbreviation K, for millionths M, for billionths B. To enable the use of abbreviations of values, set the checkbox next to Use Abbreviation in the format editor.
Negative red - Highlight all negative numbers with numeric, currency, and percentage formatting. This functionality will work for both reports and dashboards. To do this, set the checkbox next to Negative in Red in the format editor. Now all numbers that are less than zero will be marked in red.
Export to JSON - To convert the report, click Save in the report viewer, select the item Data File... and select JavaScript Object Notation (JSON) as the file type. You can export a whole report or data only or data with header and footers.
Exporting tables to Data - In the dashboard Table element, you now can export data of various types to files. To do this, when viewing the dashboard, click the Save button on the Table element and select the Data item. In the export settings menu, choose the type of data file (CSV, DBF, XML, JSON, DIF, SYLK) to which the contents of the Table element should be converted.
Export settings - This version adds export settings when exporting dashboards or their elements to various formats. You can change the page size, orientation, image quality, image type and scale. Export settings are displayed in a pop-up dialog, after selecting the export command and before starting the process of converting dashboards or their elements.
Editing the rendered dashboard - The Edit button has been added to the dashboard preview. This button calls the report designer and opens the rendered dashboard. In the report designer, you can edit the dashboard and save the changes. You will these changes in the viewer.
Calculation of totals by condition - It is now possible to use the functions of calculated totals with conditions in dashboard elements. The SumIf(,) function is used to sum the data field values by a condition, and the CountIf(,) function is used to count the number of values in a data field by a condition. The first argument in these functions is the data field, and the second is the condition for fetching values.
Adds abbreviations in formatting, for example K for thousands.
Features
Abbreviations in formatting - You can now use abbreviated numbers with numeric and currency formatting in reports. For example, for thousands of values you may use the abbreviation K, for millionths M, for billionths B. To enable the use of abbreviations of values, set the checkbox next to Use Abbreviation in the format edito
Pareto Chart - When designing reports and dashboards, you now have the ability to create Pareto charts. This type of chart contains both bars and a line graph, where individual values are represented in descending order by bars, and the cumulative total is represented by the line.
Text in cells - A new component Text in Cells has been added to Reports.JS. You can use this component for designing reports.
Highlight all negative numbers with numeric, currency, and percentage formatting.
Features
Pareto Chart - When designing reports and dashboards, you now have the ability to create Pareto charts. This type of chart contains both bars and a line graph, where individual values are represented in descending order by bars, and the cumulative total is represented by the line.
Negative red - Highlight all negative numbers with numeric, currency, and percentage formatting. This functionality will work for both reports and dashboards. To do this, set the checkbox next to Negative in Red in the format editor. Now all numbers that are less than zero will be marked in red.
Export to JSON - To convert the report, click Save in the report viewer, select the item Data File... and select JavaScript Object Notation (JSON) as the file type. You can export a whole report or data only or data with header and footers.
Pareto Chart - When designing reports and dashboards, you now have the ability to create Pareto charts. This type of chart contains both bars and a line graph, where individual values are represented in descending order by bars, and the cumulative total is represented by the line.
Abbreviations in formatting - You can now use abbreviated numbers with numeric and currency formatting in reports or dashboards. For example, for thousands of values you may use the abbreviation K, for millionths M, for billionths B. To enable the use of abbreviations of values, set the checkbox next to Use Abbreviation in the format editor.
Negative red - Highlight all negative numbers with numeric, currency, and percentage formatting. This functionality will work for both reports and dashboards. To do this, set the checkbox next to Negative in Red in the format editor. Now all numbers that are less than zero will be marked in red.
Export to JSON - To convert the report, click Save in the report viewer, select the item Data File... and select JavaScript Object Notation (JSON) as the file type. You can export a whole report or data only or data with header and footers.
Pareto Chart - When designing reports, you now have the ability to create Pareto charts. This type of chart contains both bars and a line graph, where individual values are represented in descending order by bars, and the cumulative total is represented by the line.
Abbreviations in formatting - You can now use abbreviated numbers with numeric and currency formatting in reports or dashboards. For example, for thousands of values you may use the abbreviation K, for millionths M, for billionths B. To enable the use of abbreviations of values, set the checkbox next to Use Abbreviation in the format editor.
Export to JSON - To convert the report, click Save in the report viewer, select the item Data File... and select JSON as the file type. You can export a whole report or data only or data with header and footers.
Report Designer - Simple and functional report designer. Generate reports for any of the supported platforms.
Dashboard Items - Data on a dashboard can be processed, filtered, displayed and visually styled. The processing and displaying of data is carried out using the following elements - Table, Chart, Gauge, Pivot, Indicator, Progress, and Map. You can filter data by time range, using the Date Picker, by lists of values using the simple, drop-down, hierarchical, or drop-down hierarchical options. You can personalize your dashboards using Text, Image and Shape elements.
Report Viewer - The report viewer was designed using HTML5 and JavaScript. It works on any web browser that supports those technologies and can operate autonomously without having a server-side. It support dashboard element interactivity, full-screen mode, dashboard exporting to PDF, Excel, and PNG files and more.
Adds new customizable data analysis and processing tool for the JavaScript platform.
Features
New product Dashboards.JS - A powerful, flexible and customizable data analysis and processing tool for the JavaScript platform. All that is needed is a JavaScript and HTML5 browser. Installing additional .NET, Java or Flash components is not required. Therefore, Dashboards.JS will work on most devices (from desktop computers to mobile devices). Dashboards.JS can work as a client-side or server-side solution and the tool is fully compatible with Node.js.
Pareto Chart - When designing reports and dashboards, you now have the ability to create Pareto charts. This type of chart contains both bars and a line graph, where individual values are represented in descending order by bars, and the cumulative total is represented by the line.
Top N Values - Chart, Indicator, Progress and Pivot dashboard elements can now display top values.
Disabling columns in Table - You can now hide columns in dashboard Table elements. In order to apply this, select the data field in the element editor and uncheck the Visible option.
Hyperlinks in values of a table - You can now set hyperlinks, if the field type is defined as a Dimension, for data field values.
Interaction - You can now customize interactive actions when viewing the dashboard. Depending on a specific user action, a hint can be displayed, data filtering can be applied, or transition by a hyperlink. Actions can be defined for items such as Chart, Regional Map, and Table.
Abbreviations in formatting - You can now use abbreviated numbers with numeric and currency formatting in reports or dashboards. For example, for thousands of values you may use the abbreviation K, for millionths M, for billionths B. To enable the use of abbreviations of values, set the checkbox next to Use Abbreviation in the format editor.
Negative red - Highlight all negative numbers with numeric, currency, and percentage formatting. This functionality will work for both reports and dashboards. To do this, set the checkbox next to Negative in Red in the format editor. Now all numbers that are less than zero will be marked in red.
Export to JSON - To convert the report, click Save in the report viewer, select the item Data File... and select JavaScript Object Notation (JSON) as the file type. You can export a whole report or data only or data with header and footers.
Exporting tables to Data - In the dashboard Table element, you now can export data of various types to files. To do this, when viewing the dashboard, click the Save button on the Table element and select the Data item. In the export settings menu, choose the type of data file (CSV, DBF, XML, JSON, DIF, SYLK) to which the contents of the Table element should be converted.
Export settings - This version adds export settings when exporting dashboards or their elements to various formats. You can change the page size, orientation, image quality, image type and scale. Export settings are displayed in a pop-up dialog, after selecting the export command and before starting the process of converting dashboards or their elements.
Editing the rendered dashboard - The Edit button has been added to the dashboard preview. This button calls the report designer and opens the rendered dashboard. In the report designer, you can edit the dashboard and save the changes. You will these changes in the viewer.
Calculation of totals by condition - It is now possible to use the functions of calculated totals with conditions in dashboard elements. The SumIf(,) function is used to sum the data field values by a condition, and the CountIf(,) function is used to count the number of values in a data field by a condition. The first argument in these functions is the data field, and the second is the condition for fetching values.
Text in cells in Reports.JS - A new component Text in Cells has been added to Reports.JS. You can use this component for designing reports.
New features and 3D visualization improvements, plus now supports export to AutoCAD DWG 2010.
Features
Working with 3D file formats - Delivers better 3D experience with its new features and general improvements of visualization.
Display of a 3D model bounding box and its overall dimensions.
Dynamic section tool. It enables to create a section view of a 3D model, see its hidden elements and measure them when necessary.
Tool to adjust level of transparency of a 3D model.
New visualization option to display 3D model edges.
STEP to IGES/IGES to STEP converter.
Anti-aliasing in 3D modes. It improves image quality by making jagged lines and borders look smoother.
New mode of surface display: Hidden lines.
Improved reading of SAT, OBJ and STL files.
Working with AutoCAD DWG and DXF files - The new version of CADEditorX also focuses on enhancing a feature set for those who work with DWG and DXF files.
Improved import of DWG and DXF files:
support of annotative objects;
reading of hyperlinks for entities;
improved Insert and Clipping support;
improved Texts and MTexts support;
improved display of SHX fonts;
speeded up loading of DXF files.
Export to AutoCAD DWG 2010.
Improved comparison of DWG and DXF files: new comparison settings and capability to print out results of comparison.
Extended features of G-code generation from DWG and DXF files.
XML API improvements - Version 14 adds extended capabilities to its unique XML API containing a single function and a single event.
XData support. Extended Entity Data (EED) handling via XML.
Programmatic file comparison.
Programmatic merging of many DXF files to one PDF file.
Creating an arc based on three points and a gradient hatch via XML.
Modification of dimension texts via XML.
Reading/recording of Layout.Plotsettings via XML.
Extended output on the Get command.
Other improvements
Optimized batch conversion of files.
Improved export of PDF files:
saving of fonts;
option for saving to raster PDF files.
Option for automatic regeneration.
New mode of grid displaying.
Object layer map allowing to automatically adjust distribution of entities by layers.
GrapeCity blog post to help you circumvent vulnerabilities that can occur with Angular.
Angular is a great platform for building responsive, universal Single Page Applications. In this blog post, GrapeCity content contributor Limor Wainstein takes you through the common vulnerabilities that can seep in through obsolete dependencies, bad coding practices, or irregularities in patching updates. Topics covered include:
Preventing Cross-Site Scripting (XSS)
Angular Sanitation and Security Contexts
The Sanitize() Method
Authentication in Angular using JSON Web Tokens
Much more...
View the blog post to learn more about keeping your Angular code secure.